Back to Extensions
ResponseTime Monitor
4.4(0)
2,000 users
Preview
1 / 4
About this extension
Extension
Developer Tools
Shows the response times of up to three webservers. Useful to see how the internet/server connection performs.\n\nWhat can I do with this extension?
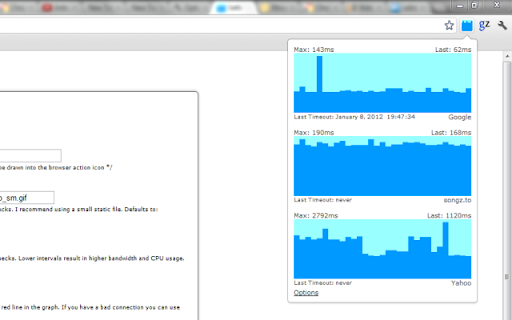
Basically this extension shows you the response time of a webserver and draws a nice chart.
What can I do with this information?
You can see how your internet connection performs or how fast your own webserver responds.
What does the chart show?
It shows the last 31 response times. Higher bars mean higher response times. If the request timed out it shows a red bar.
How can I interpret these response times?
If the bars are about the same height it is a sign for a healthy internet connection/server load. If there are red lines and blue lines mixed up or the chart is very volatile your internet connection is unstable or the server is overloaded. If it shows only red something is terribly wrong ...
Why does this need permission to "Your data on all websites"?
To perform checks to a user specific URL it is required that the extension can send requests to 'all websites'.
Developer
U
Unknown Developer
Extension Info
Version
2.0
Updated
March 15, 2020
Size
49.63KiB
Languages
English
Users
2,000
Developer
U
Unknown Developer
Extension Info
Version
2.0
Updated
March 15, 2020
Size
49.63KiB
Languages
English
Users
2,000