Back to Extensions
WebGPU Inspector
5.0(3)
1,000 users
Preview
1 / 3
About this extension
Extension
Developer Tools
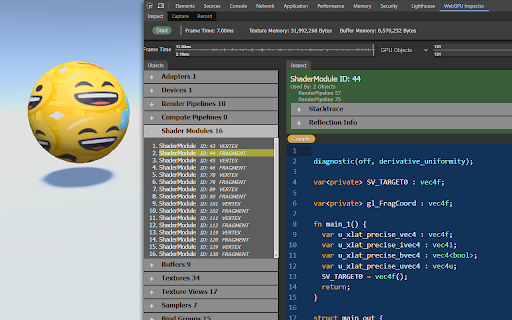
WebGPU Inspector Debugging Tools\n\nWebGPU Inspector is a Chrome Developer Tools extension for debugging WebGPU content. It intercepts all WebGPU objects and commands, allowing you to inspect information about any GPU object.
* Inspect any WebGPU object, with a stacktrace for where it was created.
* Capture frames, including all commands, buffers, textures, and render pass results.
* Catch errors compiling shader modules and pipelines.
* Display textures, at any mip level.
* Edit shaders live on the page to debug and test shader changes.
* Debug shaders (highly experimental, work in progress, limited to compute shaders).
* Plot frame times and GPU object counts over time for profiling information.
* View uniform and storage buffer content used for draw and dispatch calls.
* Record all commands and data used to render a set of frames, generating a standalone HTML file that can recreate the render.
Badges
Recommended
Highly recommended extensionDeveloper
U
Unknown Developer
Extension Info
Version
0.11.0
Updated
February 23, 2025
Size
283KiB
Languages
English (United States)
Users
1,000
Developer
U
Unknown Developer
Badges
Recommended
Highly recommended extensionExtension Info
Version
0.11.0
Updated
February 23, 2025
Size
283KiB
Languages
English (United States)
Users
1,000